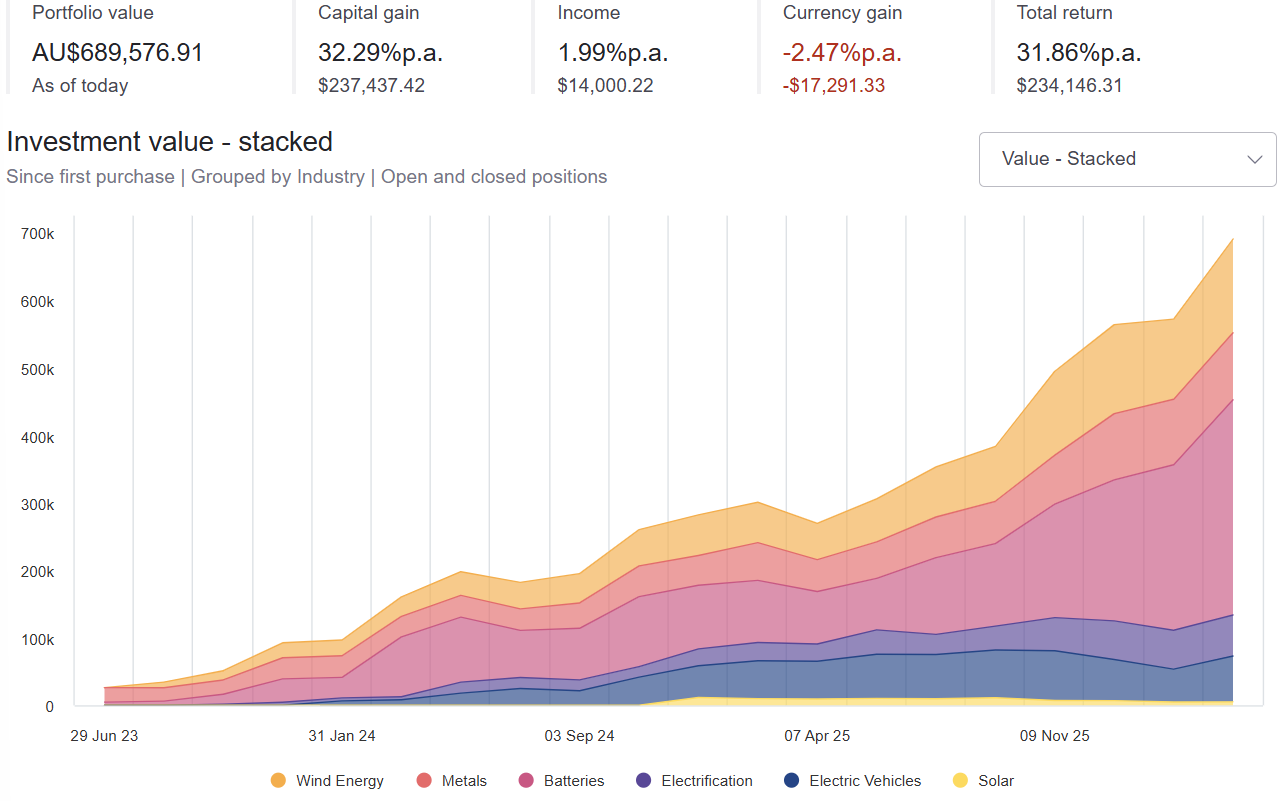
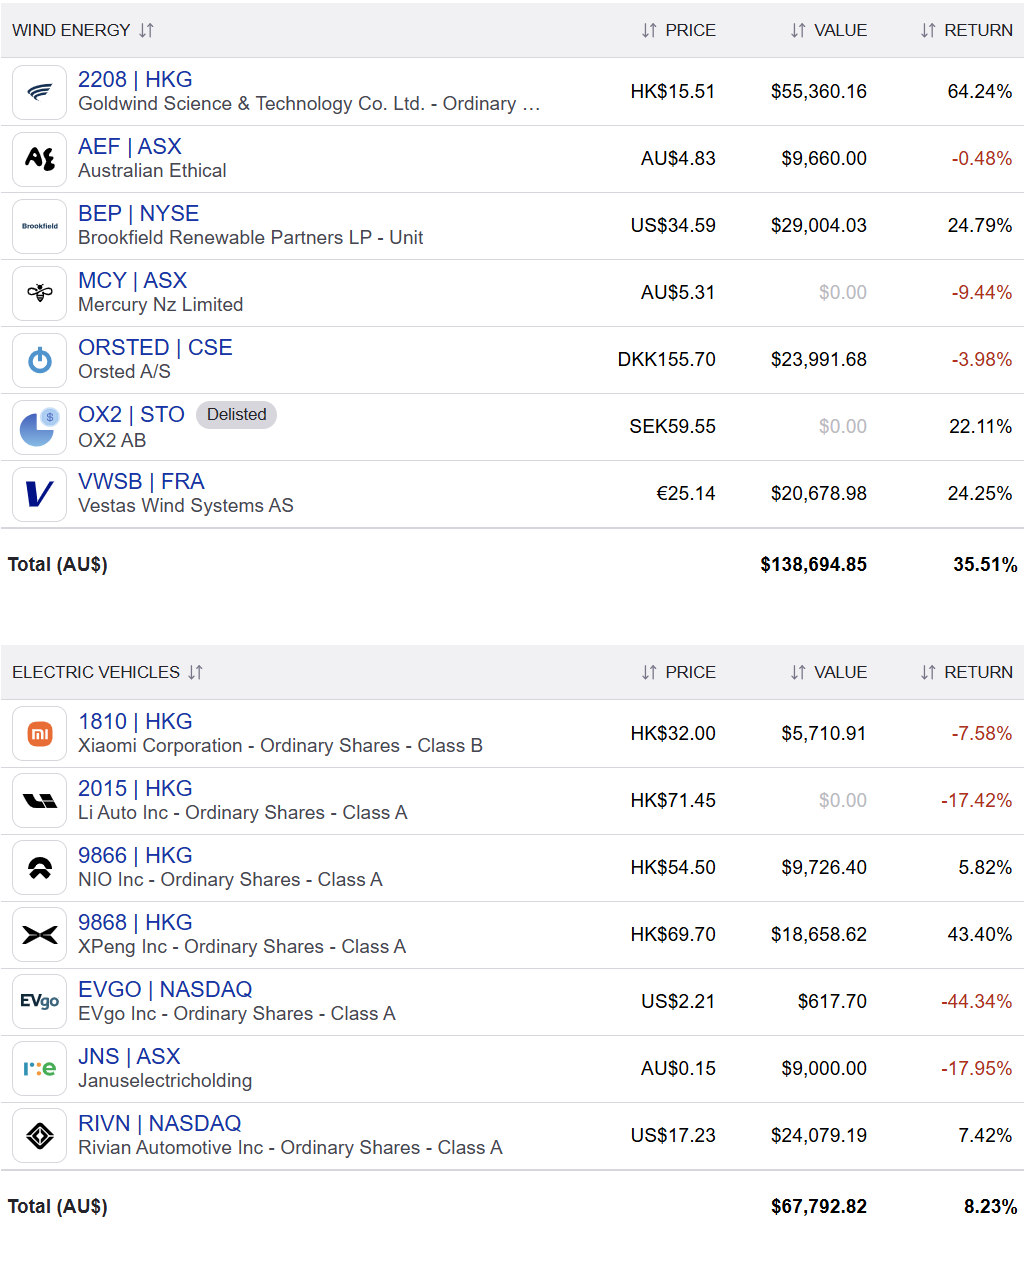
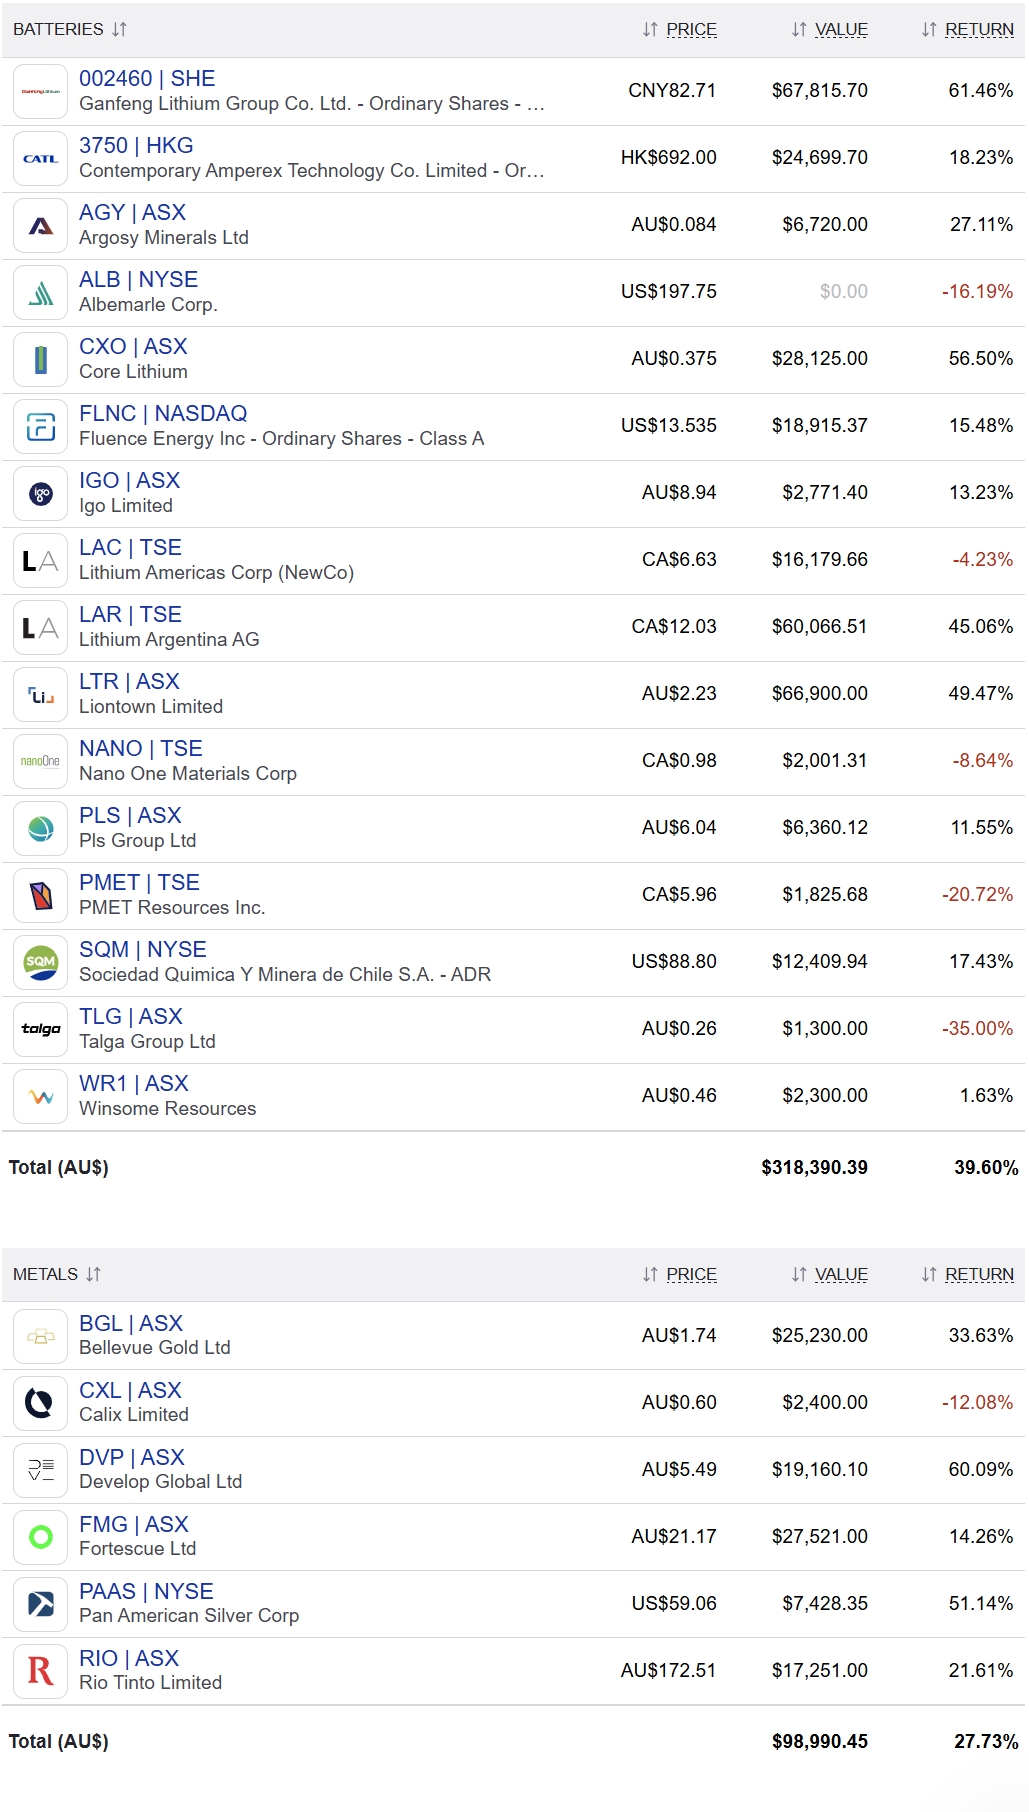
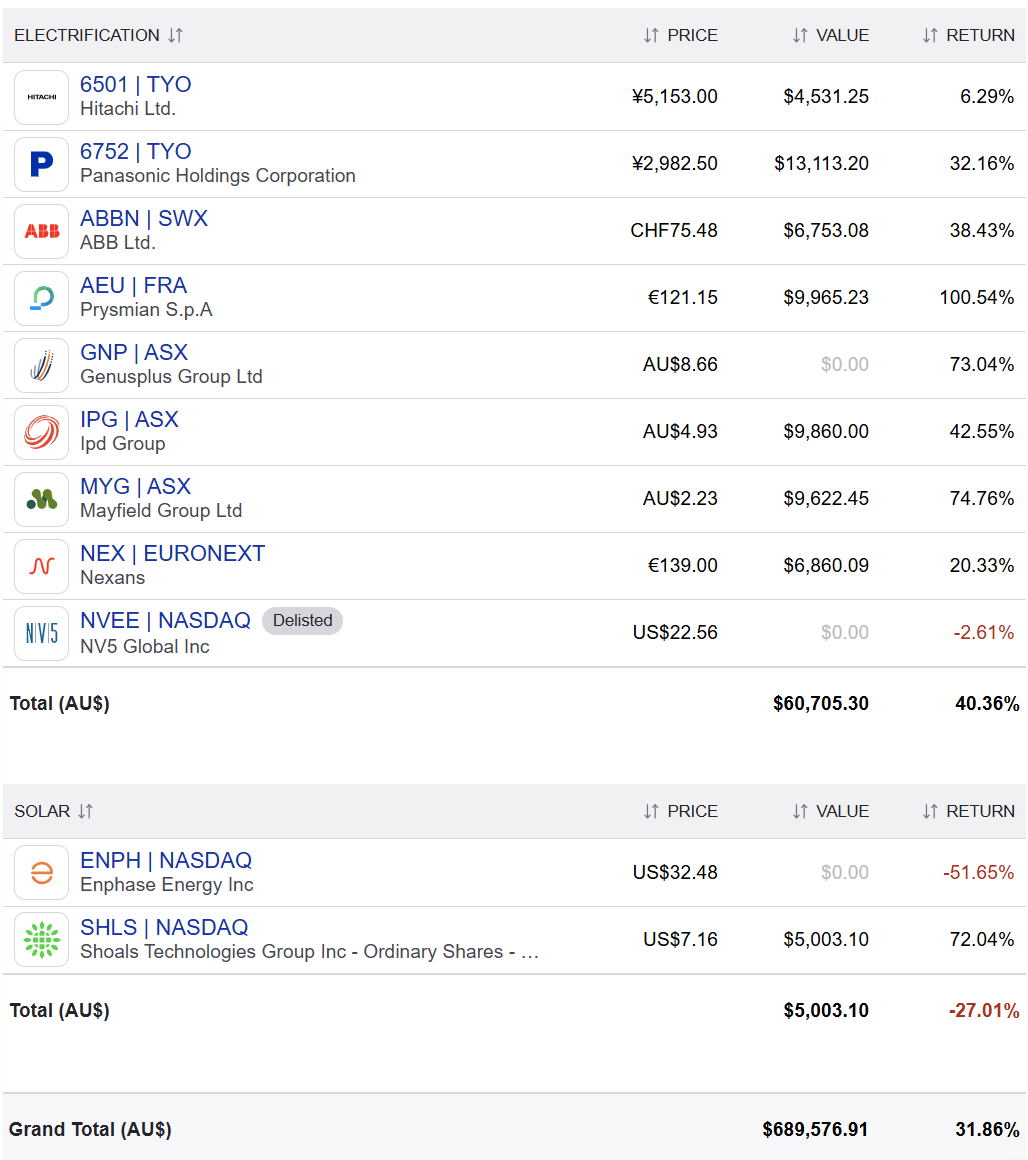
Scorecard

The scorecard measures the performance of the investments made as The Clean Energy Investor' from 15 May 2023, with each share transaction detailed in the blog. Dollar values are AUD unless stated otherwise. Returns are calculated as compounding. I.e. the year on year growth rate that would be required to achieve the total return.
Clean Energy Investor Scorecard
Wind Energy | Price | Qty | value | Capital Gains | Dividends | Currency | Return | |
---|---|---|---|---|---|---|---|---|
2208.HKGGoldwind Science & Technology Co. Ltd. - Ordinary Shares - Class H | HK$6.22 | 20,000 | 25,724.32 | 8,311.65 | 673.62 | 1,249.26 | 10,234.53 | |
BEP.NYSEBrookfield Renewable Partners LP - Unit | US$23.11 | 300 | 11,151.69 | -915.05 | 163.74 | 832.65 | 81.34 | |
HMC.ASXHmc Capital Limited | $9.95 | 500 | 4,975.00 | -1,176.60 | 0.00 | 0.00 | -1,176.60 | |
ORSTED.CSEOrsted A/S | DKK348.50 | 200 | 15,496.00 | -16.15 | 0.00 | -25.63 | -41.78 | |
SEK59.55 | 0 | 0.00 | 298.55 | 0.00 | 8.61 | 307.16 | ||
VWSB.FRAVestas Wind Systems AS | €14.39 | 350 | 8,353.53 | -2,936.50 | 0.00 | 203.99 | -2,732.51 | |
Total (AU$) | 65,700.54 | 3,565.90 | 837.36 | 2,268.88 | 6,672.14 | |||
Electric Vehicles | Price | Qty | value | Capital Gains | Dividends | Currency | Return | |
2015.HKGLi Auto Inc - Ordinary Shares - Class A | HK$96.05 | 600 | 11,917.14 | 2,118.19 | 0.00 | 814.21 | 2,932.40 | |
9866.HKGNIO Inc - Ordinary Shares - Class A | HK$35.15 | 700 | 5,088.00 | -2,009.96 | 0.00 | 510.23 | -1,499.73 | |
9868.HKGXPeng Inc - Ordinary Shares - Class A | HK$44.70 | 1,500 | 13,865.08 | 3,558.59 | 0.00 | 711.99 | 4,270.58 | |
RIVN.NASDAQRivian Automotive Inc - Ordinary Shares - Class A | US$16.49 | 700 | 18,566.84 | 1,595.55 | 0.00 | 1,335.96 | 2,931.51 | |
Total (AU$) | 49,437.06 | 5,262.37 | 0.00 | 3,372.39 | 8,634.76 | |||
Battery Materials | Price | Qty | value | Capital Gains | Dividends | Currency | Return | |
002460.SHEGanfeng Lithium Group Co. Ltd. - Ordinary Shares - Class A | CNY33.05 | 4,000 | 29,047.19 | 1,016.27 | 289.92 | 1,264.34 | 2,570.53 | |
ALB.NYSEAlbemarle Corp. | US$85.23 | 50 | 6,854.59 | -4,361.71 | 134.55 | 490.33 | -3,736.83 | |
CXO.ASXCore Lithium | $0.093 | 10,000 | 930.00 | -3,233.20 | 0.00 | 0.00 | -3,233.20 | |
IGO.ASXIgo Limited | $4.89 | 310 | 1,515.90 | -728.90 | 163.85 | 0.00 | -565.05 | |
LAAC.TSELithium Americas (Argentina) Corp | CA$4.15 | 4,890 | 22,593.50 | -4,863.98 | 0.00 | -140.66 | -5,004.64 | |
LAC.TSELithium Americas Corp (NewCo) | CA$4.59 | 1,890 | 9,658.31 | -4,837.99 | 0.00 | -210.40 | -5,048.39 | |
LTR.ASXLiontown Resources | $0.57 | 22,000 | 12,540.00 | -12,271.00 | 0.00 | 0.00 | -12,271.00 | |
NANO.TSENano One Materials Corp | CA$0.94 | 2,000 | 2,093.07 | -239.07 | 0.00 | 50.24 | -188.83 | |
PLS.ASXPilbara Min Ltd | $2.18 | 1,053 | 2,295.54 | -2,628.57 | 210.60 | 0.00 | -2,417.97 | |
PMET.TSEPatriot Battery Metals Inc | CA$3.59 | 300 | 1,199.06 | -1,961.71 | 0.00 | -14.16 | -1,975.87 | |
SQM.NYSESociedad Quimica Y Minera de Chile S.A. - ADR | US$36.05 | 100 | 5,798.62 | -3,333.69 | 89.98 | 657.86 | -2,585.85 | |
Total (AU$) | 94,525.78 | -37,443.55 | 888.90 | 2,097.55 | -34,457.10 | |||
Metals | Price | Qty | value | Capital Gains | Dividends | Currency | Return | |
BGL.ASXBellevue Gold Ltd | $1.145 | 6,000 | 6,870.00 | -1,738.90 | 0.00 | 0.00 | -1,738.90 | |
DVP.ASXDevelop Global Ltd | $2.34 | 3,490 | 8,166.60 | -319.62 | 0.00 | 0.00 | -319.62 | |
FMG.ASXFortescue Ltd | $18.41 | 1,000 | 18,410.00 | -1,032.12 | 2,757.15 | 0.00 | 1,725.03 | |
RIO.ASXRio Tinto Limited | $117.47 | 150 | 17,620.50 | 402.40 | 1,176.90 | 0.00 | 1,579.30 | |
Total (AU$) | 51,067.10 | -2,688.24 | 3,934.05 | 0.00 | 1,245.81 | |||
Electrification | Price | Qty | value | Capital Gains | Dividends | Currency | Return | |
6501.TYOHitachi Ltd. | ¥3,937.00 | 100 | 4,028.27 | -104.13 | 0.00 | -81.25 | -185.38 | |
6752.TYOPanasonic Holdings Corporation | ¥1,643.00 | 500 | 8,405.44 | 1,193.04 | 155.60 | 38.93 | 1,387.57 | |
ABBN.SWXABB Ltd. | CHF49.16 | 50 | 4,351.04 | 10.77 | 0.00 | 59.09 | 69.86 | |
NVEE.NASDAQNV5 Global Inc | US$18.77 | 280 | 8,453.60 | -2,368.93 | 0.00 | 648.78 | -1,720.15 | |
Total (AU$) | 25,238.35 | -1,269.25 | 155.60 | 665.55 | -448.10 | |||
Solar | Price | Qty | value | Capital Gains | Dividends | Currency | Return | |
ENPH.NASDAQEnphase Energy Inc | US$72.15 | 100 | 11,605.28 | -522.70 | 0.00 | 436.60 | -86.10 | |
Total (AU$) | 11,605.28 | -522.70 | 0.00 | 436.60 | -86.10 | |||
Grand Total since 15 May 2023 (AU$) | 297,574.11 | -33,095.47 | 5,815.91 | 8,840.97 | -18,438.59 |